
The Forecasting Report inside of Ad Sales Genius tallies up all values for deals and open proposals. This article will discuss the Forecasting Report and its capabilities.
Follow these steps to access the Forecasting Report:
- Click Sales using the left-hand navigation menu.

- Click on the Forecast tab to see your Forecast Report.

- Once on the Forecasting page, you'll find a number of reports and filters. Edit any of the filters to see the reports update in real time. The filter options are as follows:
- Date Range: This is the date range that the line items must fall between to be included in the Forecasting report.
- Periods: These are the time intervals that you can report on. You can select between either Month, Quarter, or Year.
- Sold by User: This is the user or users that have open proposals or open deals in the deals pipeline.
- Product: This is the product or products that are assigned to open proposals or open deals in the deals pipeline.

4. The following reports are available on the Forecast page.
- Pipeline: This report displays a color-coded graph of all forecasted sales that are in the pipeline broken down by product.
- By Product by Month: This bar graph displays a color-coded chart of each forecasted product and broken down by the month of the line item run date.
- Rep Sales: This graph displays a bar graph of the amount of forecasted sales by each sales rep
- Page Count by Size: This graph breaks down the amount of forecasted sales per product with each color in the bar representing it's own unit size.
- Page Count by Rep: This graph represents a break down of the forecasted amount each rep has sold. Each color represents it's own unit size.
- Product Type: Each bar in this graph represents a specific Product Type. Each color designates a Sales Rep.
- By Pipeline Status: This bar graph displays a breakdown of monthly forecasted sales, color-coded by Pipeline Status.
- By Product by Month: This report provides an estimated amount of sales per product for each month.
- Pages: This report provides an estimated page count for each product per month.
5. You can add any of the reports to your dashboard by hovering your mouse over the report and selecting the Add to Dashboard button.

Advanced Forecasting
- Click the Advanced Forecasting button on the Forecast page.

- Here, you can choose the line item date and how you want your values to be organized. You have the following options in this section:
Note: These fields will change depending on what you choose in the Header Column field.
- Insertion Date: This is the date range that the line items must fall between to be included in the Forecasting report.
- Header Column: This is how you would like the columns of data to be organized. There are many options presented here, so choose one that best fits your requirements.
- Time Period: This field denotes how you would like your
- Left Side Primary: The Left Side Primary drop-down menu is where you choose how you would like your rows of data to be organized. There are many options presented here, so choose one that best fits your requirements.
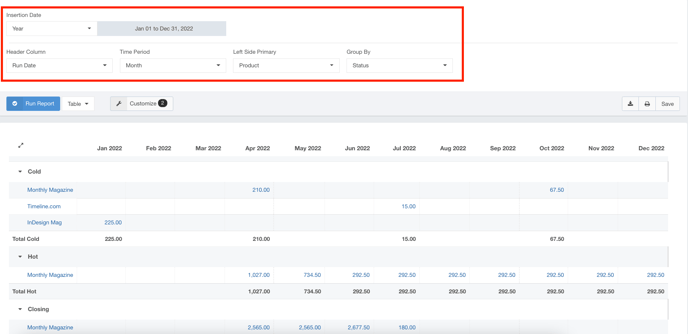
- Group By: The Group By field allows you to group the rows of data by certain specifications. For instance, if you would like to forecast based on Deal Status, you can choose Opportunity Status. When the report runs, you will see all forecasted line items grouped by the opportunity that the contract is assigned to. See the screenshot below for an example of this configuration.
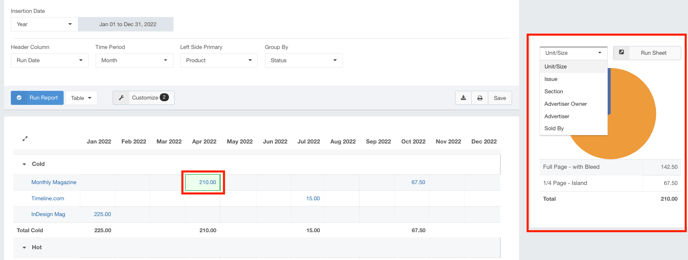
While using the report, you can click on one of the cells to view information pertaining to that value. You can use the drop-down menu in the additional information pane to view the data points in various ways.
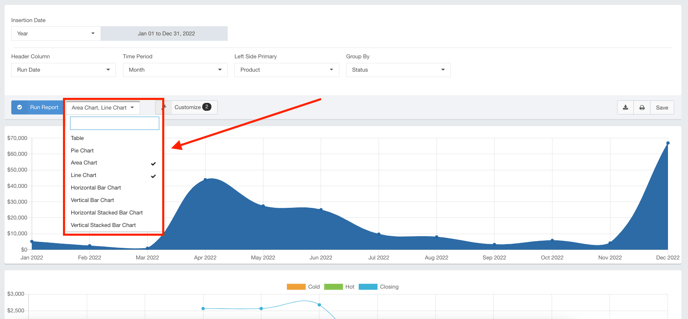
Click the Table drop-down menu to change the view for the table. You can choose several types of graphs to represent your data.
Click the Download icon to download the data as a CSV or Excel spreadsheet.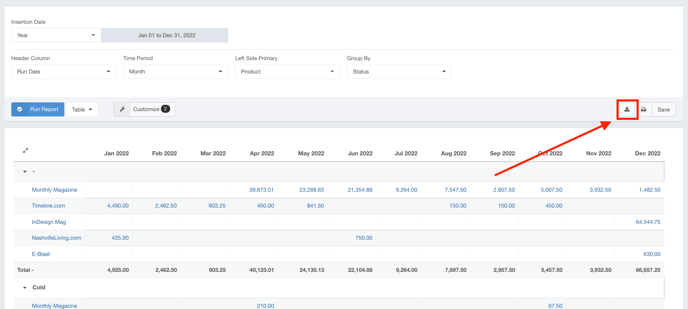
Click the Printer icon to send this report to the printer.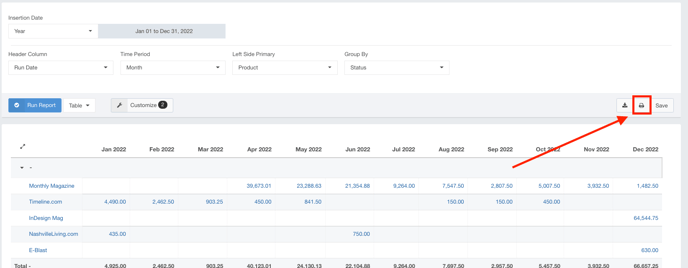
Click the Save button to save this as a customizable report and share it with a group or add it to your dashboard.