- Ad Sales Genius Knowledge Base
- Legacy Articles
Issue Statistics Widget
The Issue Statistics Widget allows you to view key pieces of data for your publication. You can use this widget to view page counts, ads sold, net sales, and more.
This article will walk you through how to configure the Issue Statistics Widget.
Add The Issue Statistics Widget To Your Dashboard
Follow these steps to add the Issue Statistics Widget to your dashboard:
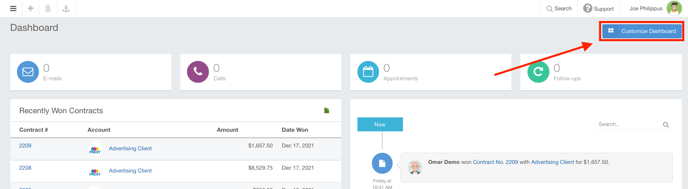
- Click the Customize Dashboard button found in the upper right-hand corner of your Dashboard.
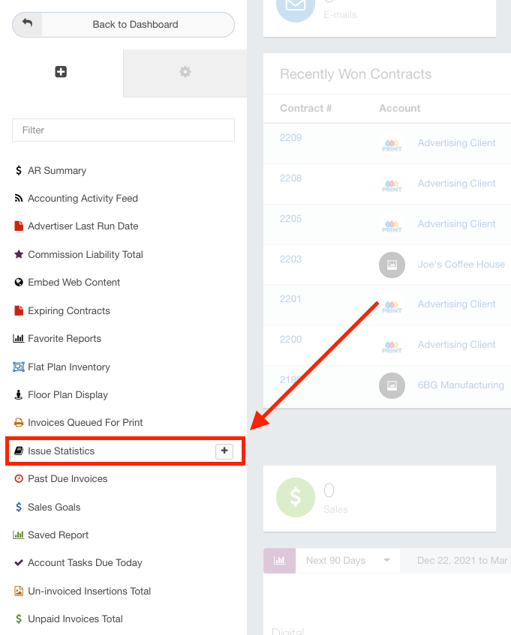
- Click on the Issue Statistics Widget to open the Widget Settings dialog where you will begin configuration.
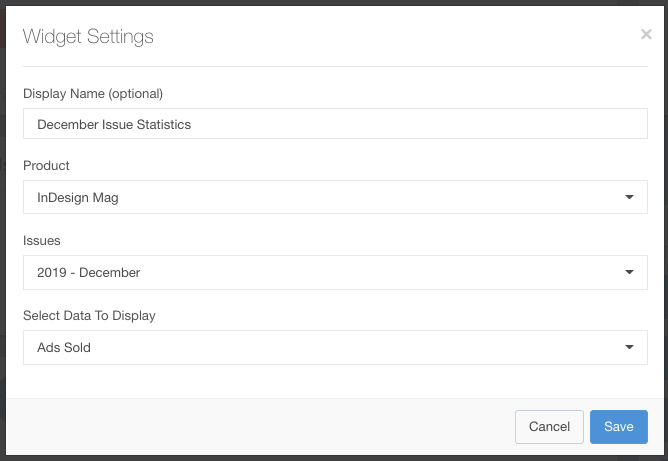
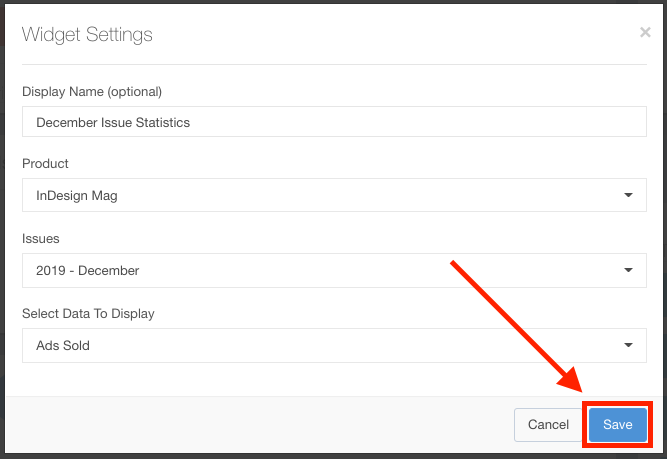
- Use the Widget Settings dialog to complete the following information:
- Display Name - This is an optional field and will be the title for this widget on your dashboard. If you leave this blank, the title will show what data you have selected to display.
- Product - Choose the Product that you would like to see statistics for.
- Issue - Choose the Issue that you would like to see statistics for.
- Select Data to Display - Here is where you can configure what data is shown.
- Ads Sold - This will show you how many ads have been sold for the configured issue.
- Ad Pages - This will display how many total ad pages have been booked. This value is broken down by decimal to account for smaller ads that do not fill an entire page.
- Invoice Net Sales - This displays the line item value for ads that have been booked for this issue.
- Average Per Ad Page - This displays the average value available per page.
- Rate Sheet Distribution of Revenue Pie Chart - This pie chart displays a breakdown of the Net Sales, Discounts, fees, and Cash Discounts for this issue.
- Ad Size Totals Bar Chart - This bar graph will display the count of each ad size that is present in the configured issue.
- Total Pages of Ads Sold Bar Chart - This chart shows the total pages of ads sold and whom they were sold by.
- Net Sales by Rep Bar Chart - This chart shows the net sales for the configured issue broken down by sales rep.
- Click the Save button when you have configured your widget.
- You can now drag and drop the widget to the area of your choosing.
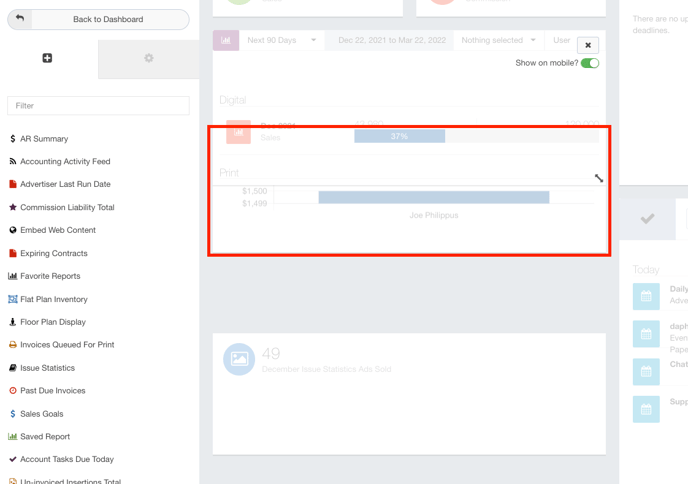
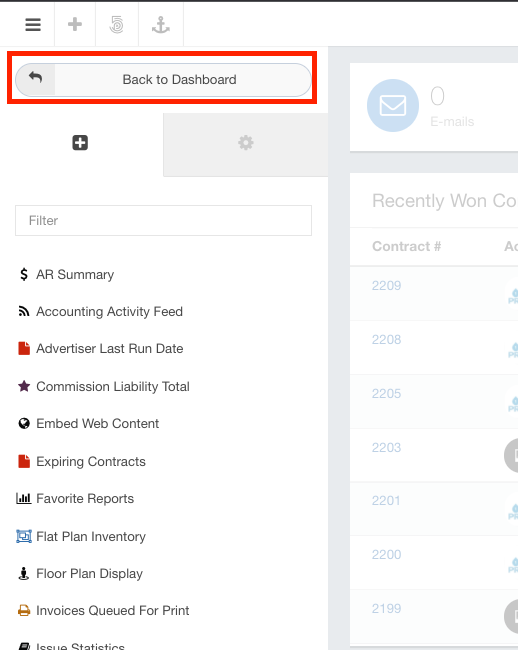
- Click the Back to Dashboard button when you are finished with your selections.