
There are several important accounting reports available to you in Ad Sales Genius. You can run reports on account balances, scheduled auto-payments, commissions, and more.
This article will discuss two of the most common accounting reports available:
- Invoice Aging Report
- Product Sales Summary and Analysis Report
Invoice Aging Report
The Invoice Aging report lets you quickly see your past due invoices and how they are aging.
To access this report, click Reports from the left-hand navigation menu, then click Invoice Aging.

You can filter this report by using the fields on the top half of the report:
- Users - Select the user responsible for this account
- As Of Date - You can use this field to change the date of when you're reviewing these invoices.
- Invoice Type - If you want to only view invoices that are on payment plans or non-payment plans, you can select that here. Otherwise, the report will pull in everything past due.
- Display - Use this field if you would like to see individual invoices that are past due or a summary of all past due invoices by accounts.

The main part of the Invoice Aging report displays the account and any amounts that are past due.
Click the Account name to display their details page.
Click the dollar amount to see a list of all of their open invoices.

If your display is set to By Invoice, then you can click on the invoice number to display that particular invoice.

Product Sales Summary and Analysis Report
The Product Sales Summary and Analysis Report lets you create customized reports. You can create custom groupings, customize the data in the X and Y axis, view the results in various graphs and charts, and more. For an in-depth look at the Product Sales Summary and Analysis Report, visit the Videos section of Ad Sales Genius by clicking the "?" icon found in the upper right-hand corner of your Ad Sales Genius application.

To Access the Product Sales Summary and Analysis Report
To access this report, click Reports from the left-hand navigation menu, then select the Product Sales Summary and Analysis report.

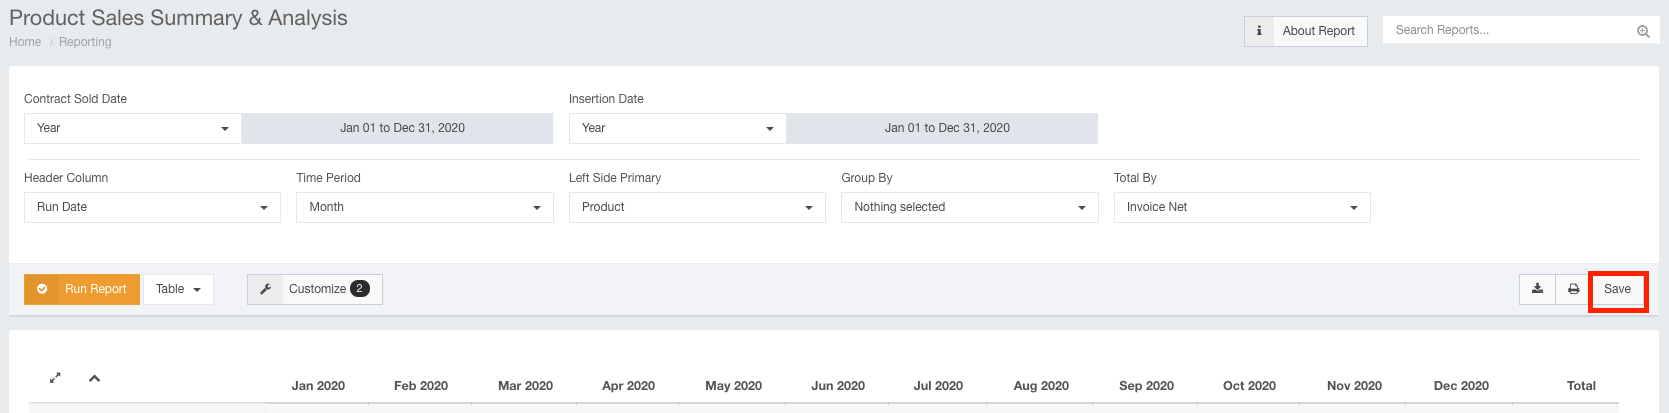
Use the top portion of this window to configure the report.
- Contract Sold Date - Use this to select a date range of contracts you would like to see in your report.
- Insertion Date - Use this to pull a certain date range of insertions you would like to see in your report.
- Header Column - Use this to select the information you would like to see across the top of your report (or the X-axis).
- Left Side Primary - This is how the information that you would like to see divided out into the rows (the Y-axis).
- Group By - Use this to group your left side primary results.
- Total By - Use this drop-down to select how you want the results totaled.
Click the Run Report button when you have made your selections.

Saving The Product Sales Summary & Analysis Report as a Custom Report
Any custom reports you make using the Sales Summary & Analysis Report can be saved and sent out to your team.
To Save and Send Your Custom Report, follow these steps:
- Configure your report in the way that you wish to send.
- Click the Save button to display the save dialog.
- Use the Save dialog to name the report and assign it to a group.
To save a group to send this report to, select the Create Group checkbox.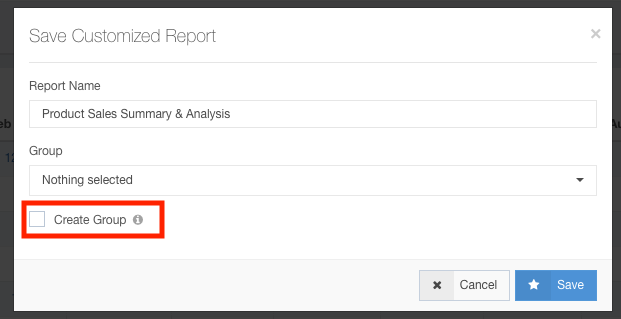
- Use the New Grouping Group dialog to name your group and select the members the report will be sent to.

- Select the Schedule Toggle switch to choose the time and frequency this report is run and sent.

- Select the Email toggle to choose which email addresses this will be sent to.

- Click the Save button to save your report.