Spend Account Tool
The Spend Account Tool allows you to see sales trends for specific client Accounts in graph form. To access to Spend Account Tool open an Account and select the Spend Button.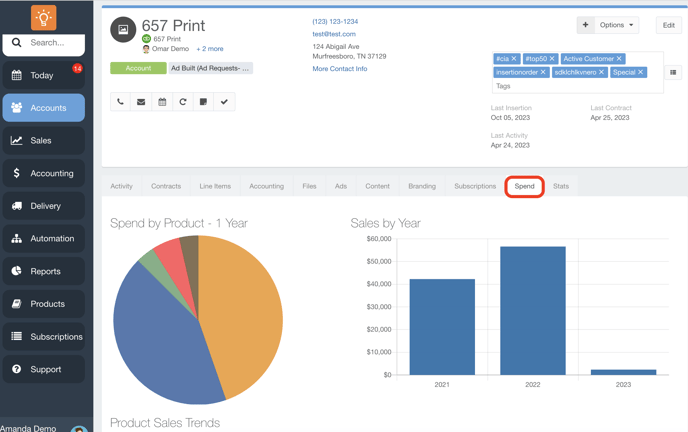
The first section of the Spend Account Tool provides you with two graphs:
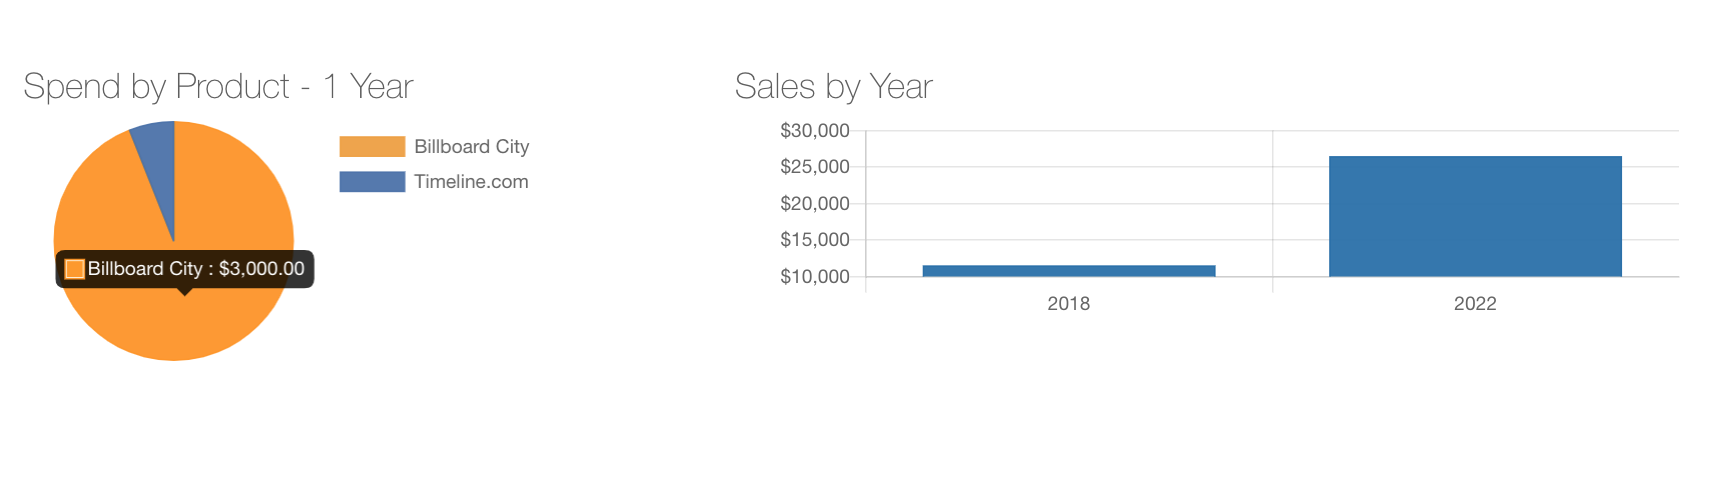
- A pie chart displaying the last year's worth of sales by Product
- A bar chart displaying the amount of sales per year
Hovering over any section of the graphs will display sales totals.
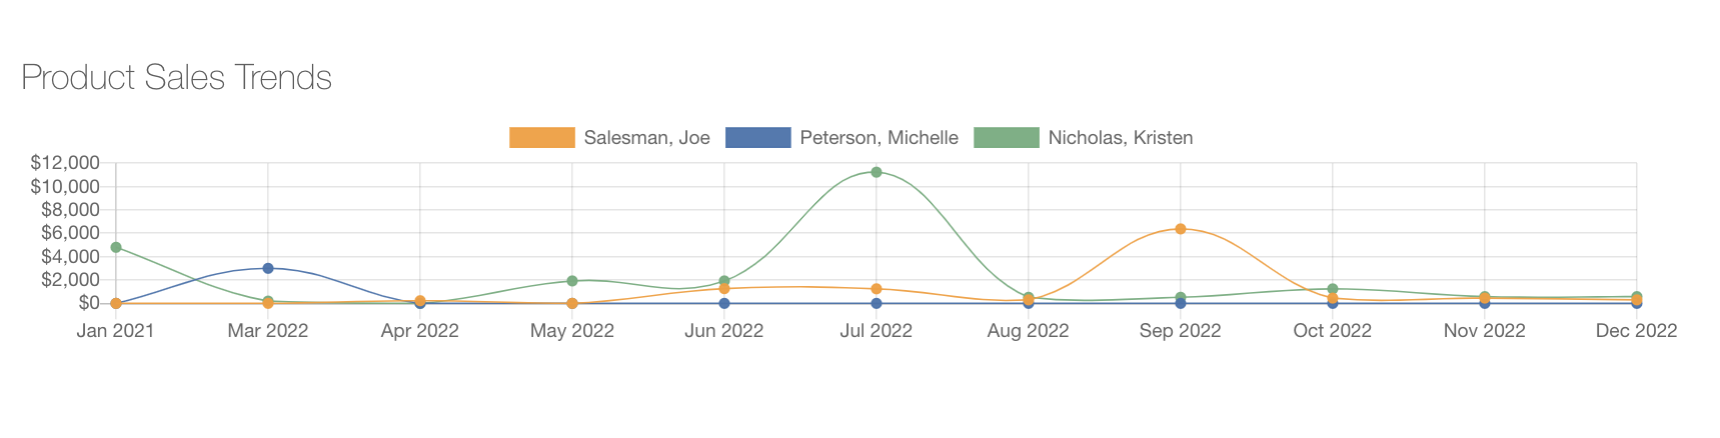
The Product Sales Trends displays sales by Sales Rep per month.
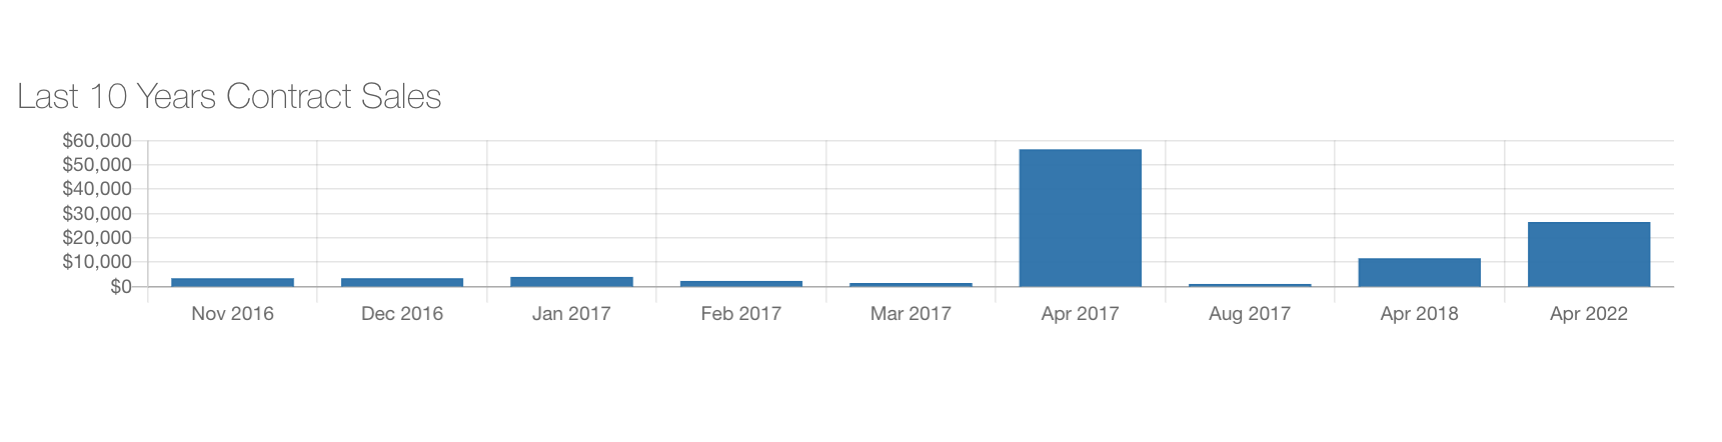
The Last 10 Years Contract Sales displays a bar graph of all sales per year for up to the past 10 years.