Advertiser Monthly Spend by Product Report
The Advertiser Monthly Spend By Product Report is a great tool to help you see exactly what your accounts are spending each month. You can completely customize this report to display the most pertinent information for your needs.
Follow these steps to configure the Advertiser Monthly Spend by Product Report:
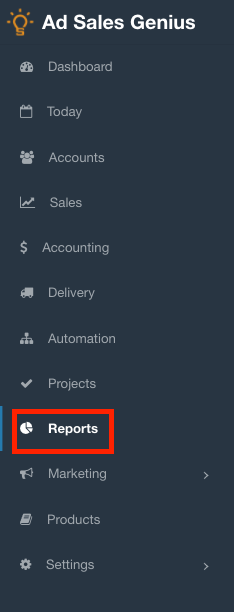
- Click Reports using the left-hand navigation menu.
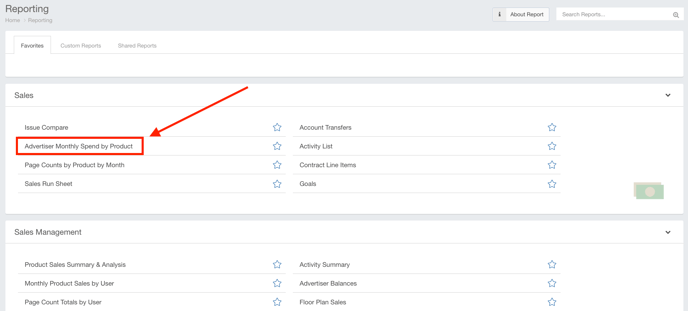
- Click on the Advertiser Monthly Spend by Product link to launch the report.
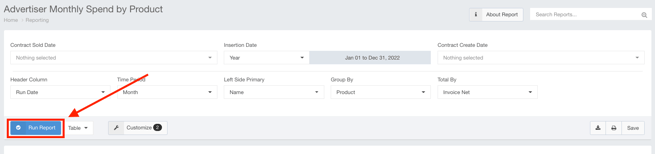
- Use the filtering options to choose how you would like the returned results to be displayed on the report. Your options are as follows:
- Contract Sold Date - If you would like your results to be filtered for contracts sold during a certain date range, you can enter this here.
- Insertion Date - This is the range that the line items actually appeared in the publication.
- Contract Create Date - If you would like your results to be filtered for contracts that were created during a certain date range, you can enter this here.
- Header Column - Because this is a pivot table, you can choose which data you would like to be represented in the columns.
- Time Period - This is where you can choose how granular you would like your results to be. This runs in conjunction with the header column.
- Left Side Primary - This menu represents what is displayed in the rows of your report.
- Group By - If you would like additional grouping in your results, you can choose that here.
- Total By - This is the value that is represented in the report. If you are looking for account spending, it is recommended to not change this value.
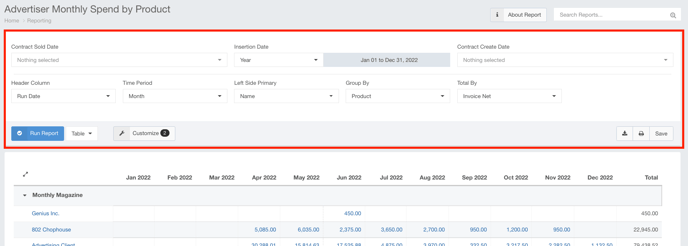
- Click the Run Report button when you are satisfied with your filtering selections.
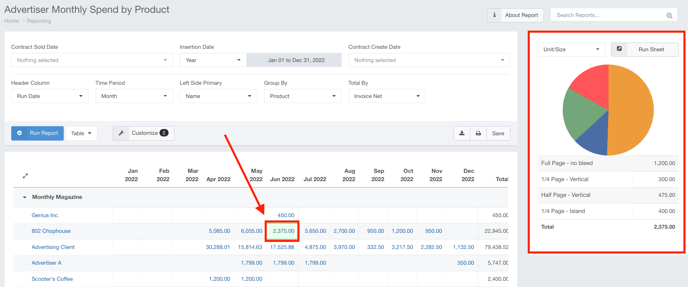
Your results are now displayed in the report section.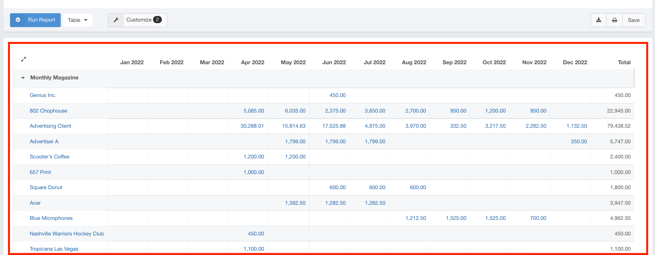
Click on one of the cell values to see a breakdown of how the system arrived at that number.